Building a Chess Analysis App (Part 2) - From Raw Games to Insight
Introduction
Once game data has been fetched, validated, and stored, the next challenge is extracting insight systematically and reusably. In my Chess Analysis project, the ChessAnalyzer class handles this step.
Where ChessFetcher focuses on getting data, the analyzer focuses on processing, summarising, and feature engineering of game data.
This post walks through the design and outputs of ChessAnalyzer, using my own account data as an example.
Pipeline & Design
The analyzer sits downstream of ChessFetcher and requires no API calls or file I/O, operating purely on in-memory data. It prepares the data for plotting performed in the Chess Analysis application components.
ChessFetcher -> ChessAnalyzer -> Insights / Features / Plots
Where ChessAnalyzer inputs a pandas DataFrame from fetcher, and outputs:
- Aggregated statistics (scalars or compact tables)
- Transformed DataFrames suitable for plotting
- Feature matrices for machine learning
I designed these design principles when I was writing the ChessAnalyzer class:
- No external dependencies or side effects
- Precomputed shared features, calculated once at initialisation
- Composable outputs, in the form of dictionaries and DataFrames, not side effects
Initialisation and Derived Features
Derived features are computed once at initialisation to maintain consistency across analyses. Examples of derived columns include:
date        user_rating opponent_rating rating_diff opponent_category result_category
2025-09-15          463              255        208       Lower Rated          Win
2025-09-15          584              447        137       Lower Rated          Win
2025-09-15          672              561        111       Lower Rated          Win
2025-09-15          609              751       -142      Higher Rated         Loss
2025-09-15          678              637         41    Similar Rating          Win
Overall Performance Statistics
High-level metrics are used to summarise overall performance, and provides a coarse summary of success and rating progression.
stats = analyzer.get_overall_stats()
| Metric | Value |
|---|---|
| Total games | 264 |
| Win rate | 45.1% |
| Starting Elo | 463 |
| Current Elo | 741 |
| Net change | +278 |
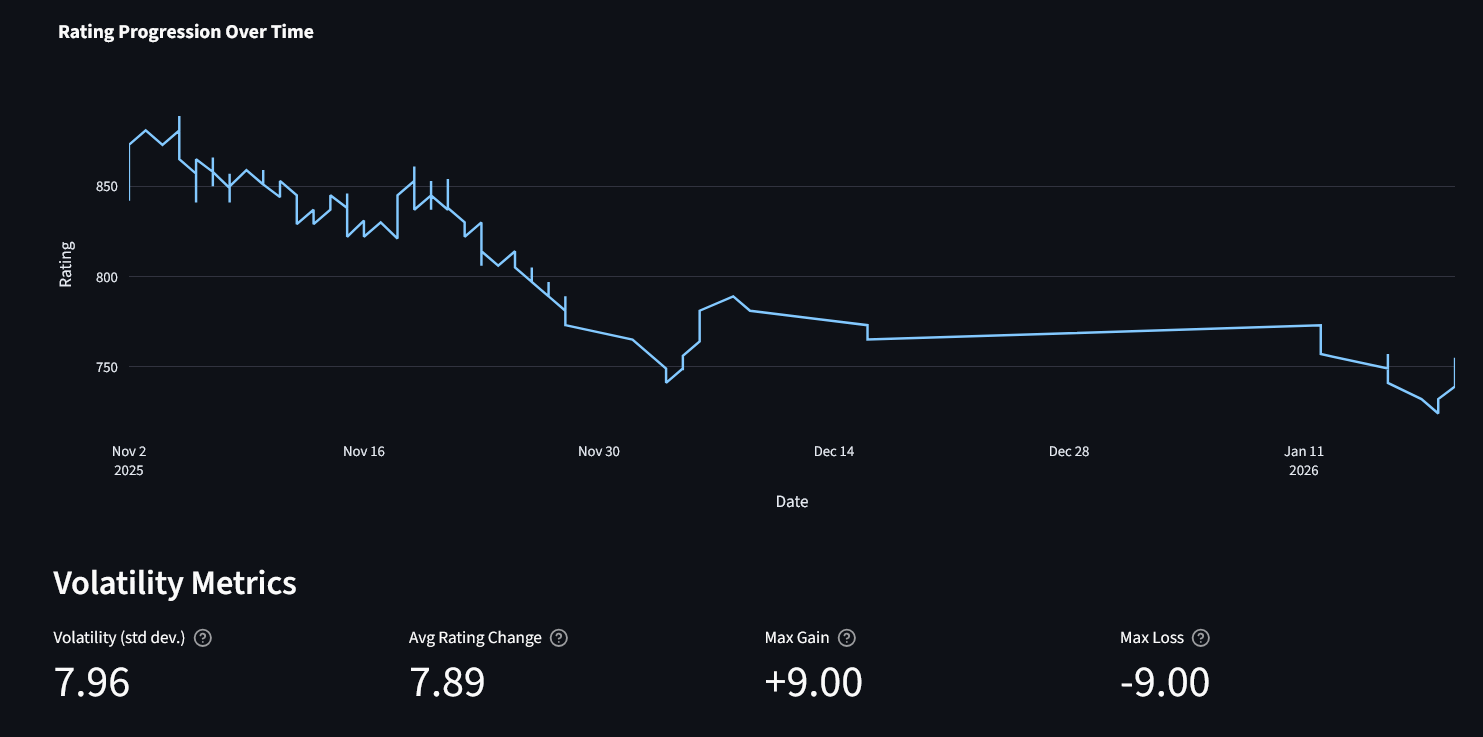
Rating Dynamics and Volatility
We allow for the user to visualise how their rating changes over time, and the volatility of these changes.
trend = analyzer.get_rating_trend()
volatility = analyzer.get_rating_volatility()
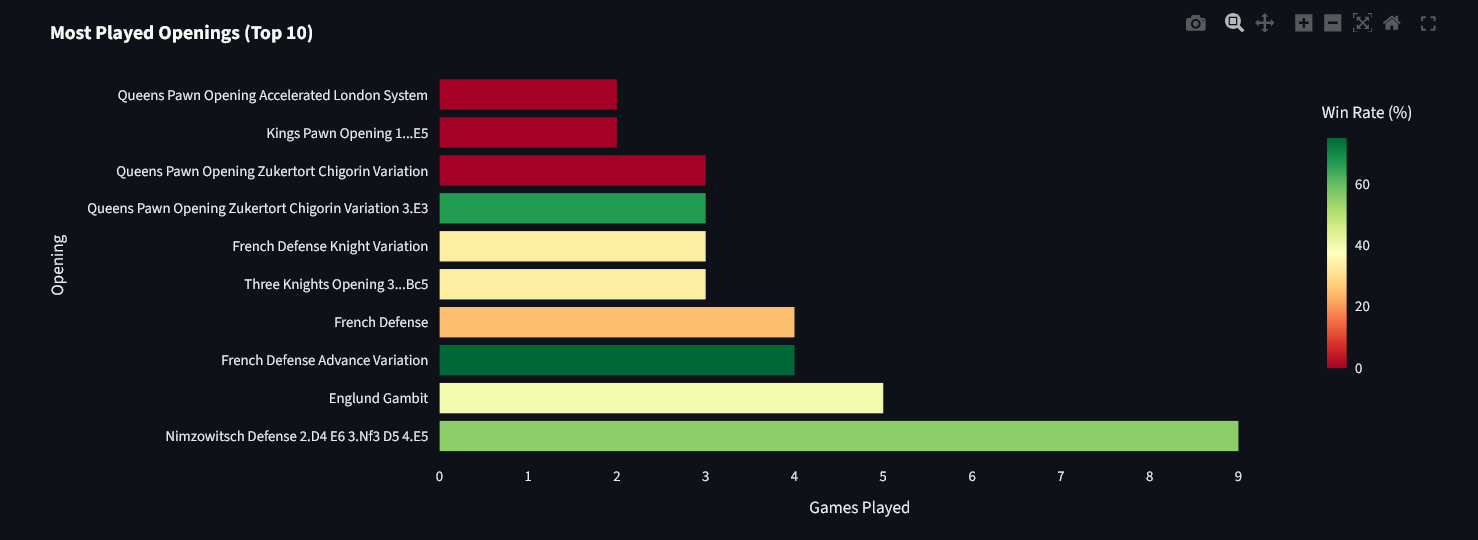
Opening Repertoire Analysis
This identifies frequently played and effective openings. It shows your preferred repertoire for winning and highlights openings to focus on improving.
openings = analyzer.get_opening_stats(top_n=10)
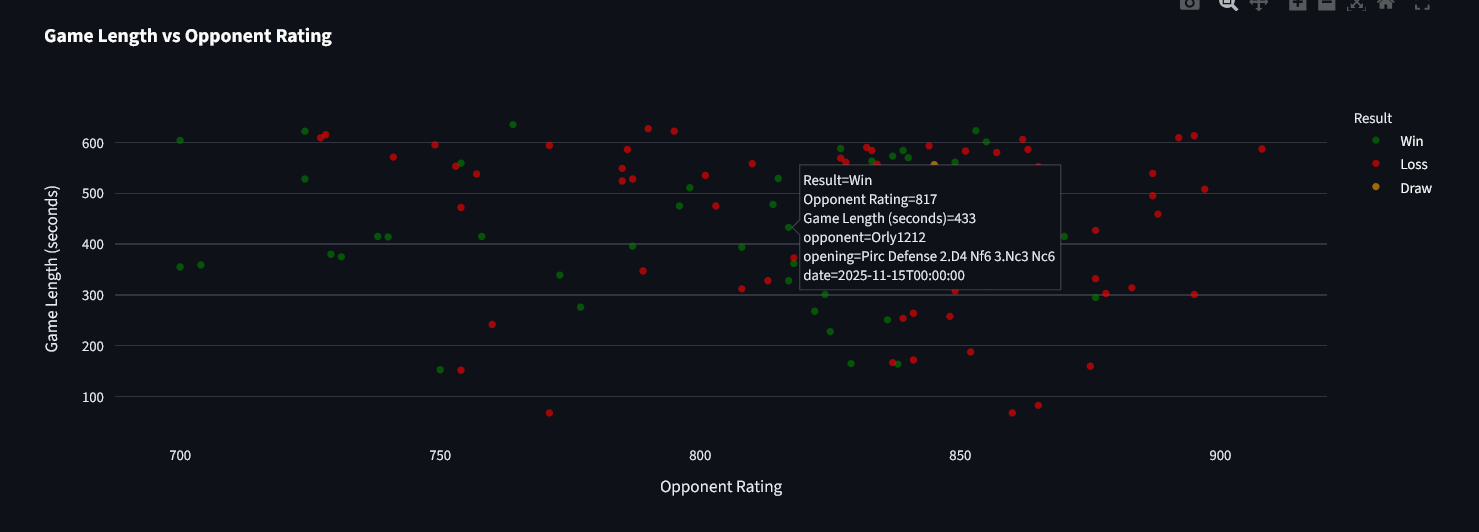
Game Duration Analysis
By formatting the results as a time series against opponent ratings, it becomes easier to visualise the types of games the user is likely to win and to quantify correlations between game length and results.
length_stats = analyzer.get_game_length_stats()
length_by_result = analyzer.get_game_length_by_result()
One interpretation could be that short-game losses indicate early blunders, while longer games suggest balanced or endgame-heavy play.
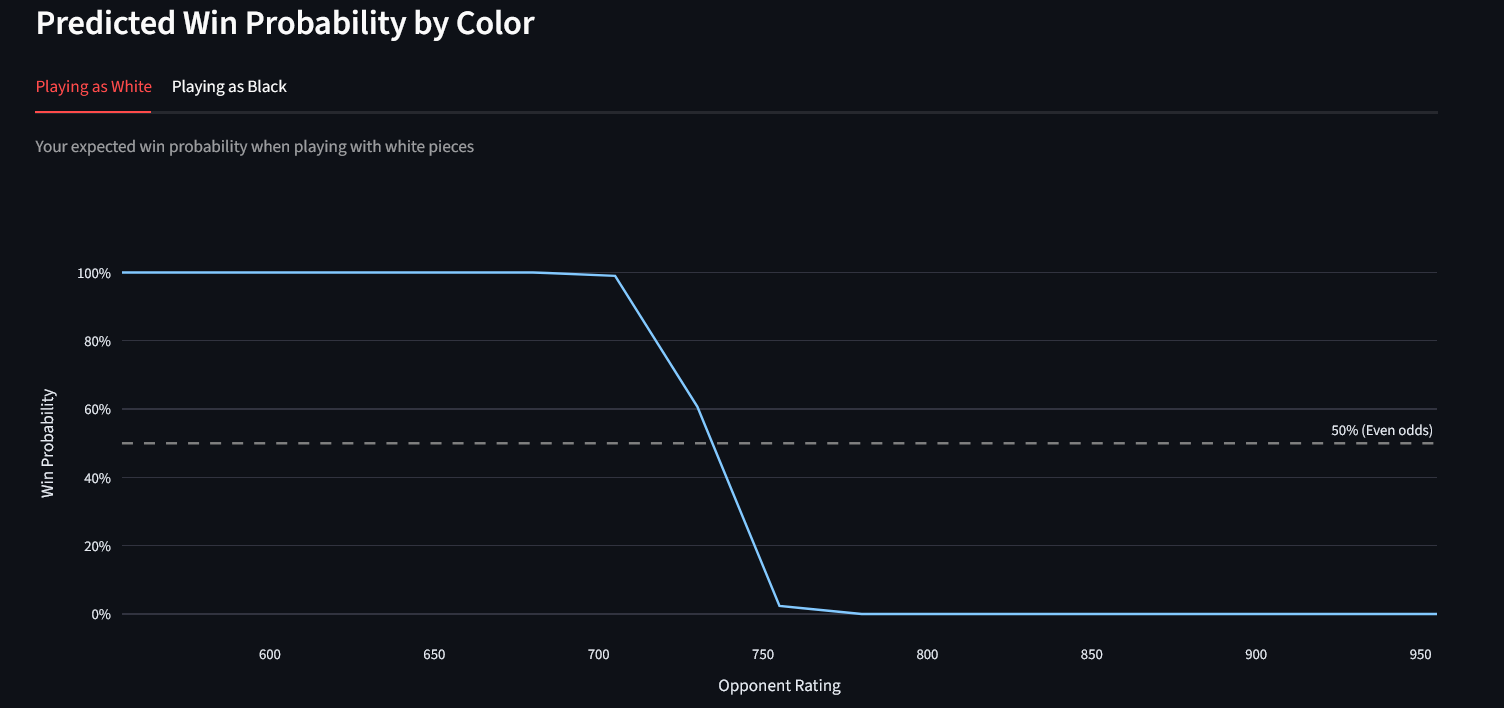
Machine Learning Feature Preparation
This method prepares pre-game features for predictive models, avoiding leakage.
X, y = analyzer.prepare_ml_features()
Features include: user rating, opponent rating, rating difference, and a binary indicator for playing White. The target is 1 = win, 0 = loss/draw. The model outputs predicted win probabilities using a logistic regression classifier.
Conclusion
By separating data acquisition from analysis, ChessAnalyzer forms the analytical core of the Chess Analysis app and converts cleaned chess game data into structured, actionable insights. It supports the following within the application:
- Descriptive statistics
- Exploratory analysis
- Dashboard visualisation
- Machine learning workflows
These outputs allow users to identify strengths and weaknesses in their play, optimise opening choices, and track rating progression over time.
Future extensions could include per-opening performance trends, endgame analysis, and more predictive models.
Leave a comment