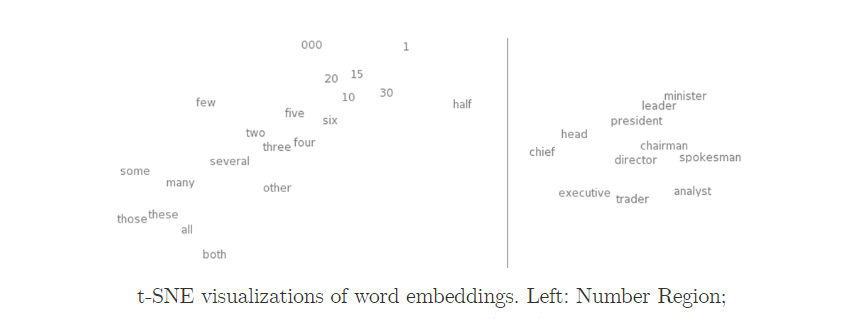
t-SNE (t-distributed Stochastic Neighbor Embedding) is a Dimensionality Reduction technique used primarily for visualizing high-dimensional data. Unlike methods such as PCA (Principal Component Analysis), which are linear, t-SNE is a non-linear method that excels at preserving the local structure of the data.
Example: https://dash.gallery/dash-tsne/
Related:
Key Characteristics of t-SNE:
- Non-linear Mapping: It attempts to capture non-linear relationships in the data by embedding it in a lower-dimensional space (usually 2D or 3D).
- Local Similarities: t-SNE preserves the local structure of the data. This means that points that are close in the high-dimensional space remain close in the lower-dimensional space.
- Global Structure: t-SNE may distort global structures to focus more on local relationships, which is both a strength and limitation.
How t-SNE Works:
- Pairwise Similarities: t-SNE first calculates pairwise similarities between data points in the high-dimensional space.
- Probability Distribution: These similarities are transformed into probabilities representing how likely it is that two points are neighbors.
- Lower-Dimensional Mapping: t-SNE tries to replicate this distribution of neighbors in the lower-dimensional space by iteratively adjusting the positions of the points.
Applications:
- Data Visualization: t-SNE is widely used in data visualization, especially when exploring clusters or patterns in high-dimensional datasets.
- Exploratory Data Analysis (EDA): It helps in finding clusters or subgroups in complex datasets, such as in genomics, image processing, or natural language processing.
Limitations:
- Computationally Intensive: t-SNE can be slow and resource-heavy, particularly on large datasets.
- Random Initialization: Results can vary due to its sensitivity to initialization and the perplexity parameter (which controls how t-SNE balances attention between local and global data structure).
- Difficult to Interpret: While t-SNE is great for visualization, interpreting the precise distances and positions of points can be tricky.
Example
# Importing libraries
import numpy as np
import pandas as pd
import matplotlib.pyplot as plt
from sklearn.datasets import load_iris
from sklearn.manifold import TSNE
from sklearn.preprocessing import StandardScaler

# Load the Iris dataset
iris = load_iris()
X = iris.data
y = iris.target

# Standardizing the features
scaler = StandardScaler()
X_scaled = scaler.fit_transform(X)

# Applying t-SNE
tsne = TSNE(n_components=2, random_state=42)
X_tsne = tsne.fit_transform(X_scaled)

# Plotting the results
plt.figure(figsize=(8, 6))
plt.scatter(X_tsne[:, 0], X_tsne[:, 1], c=y, cmap='viridis')
plt.colorbar()
plt.title('t-SNE visualization of Iris dataset')
plt.xlabel('t-SNE Component 1')
plt.ylabel('t-SNE Component 2')
plt.show()
