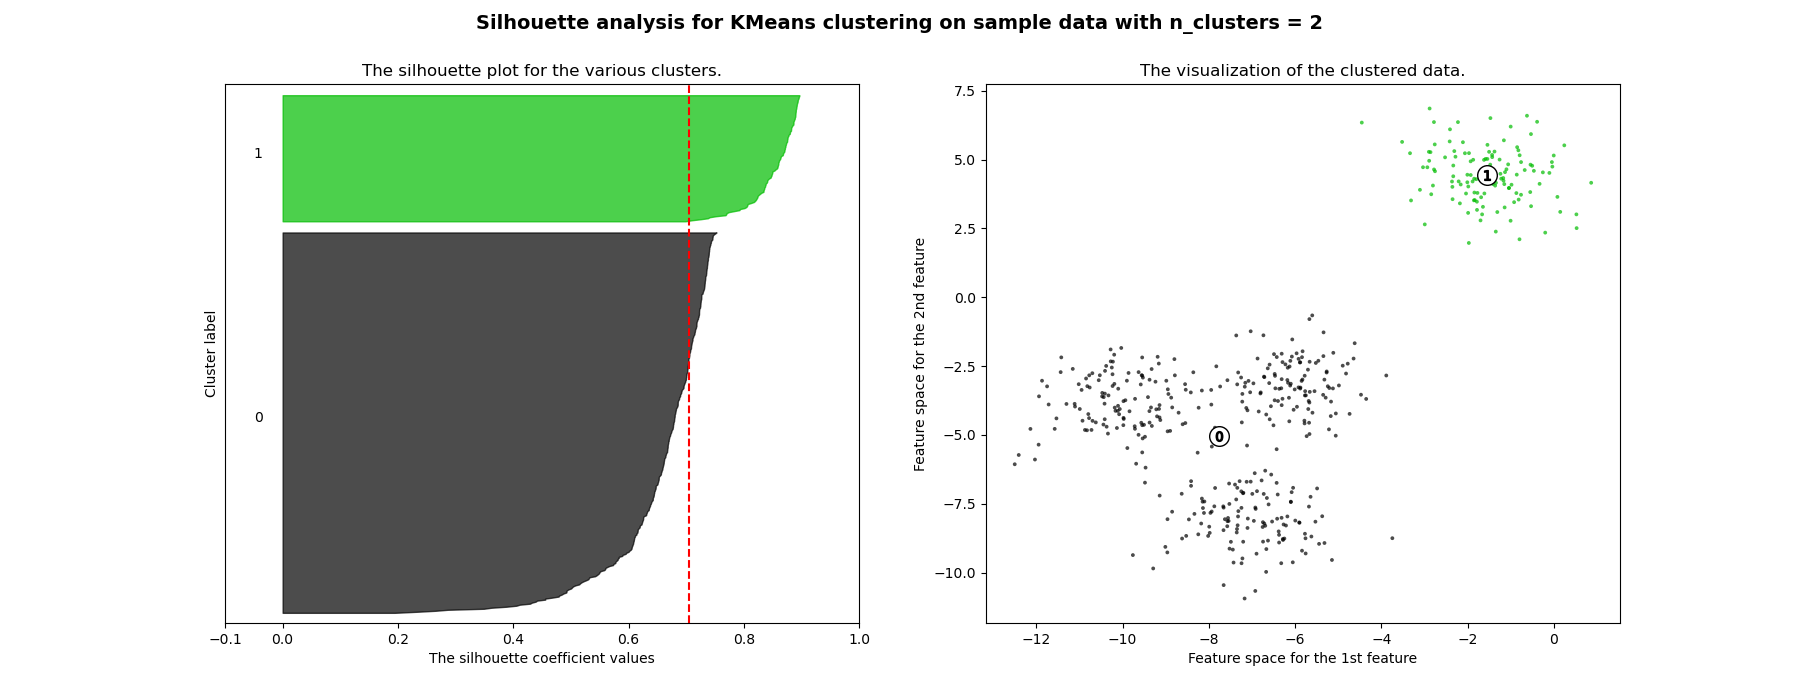
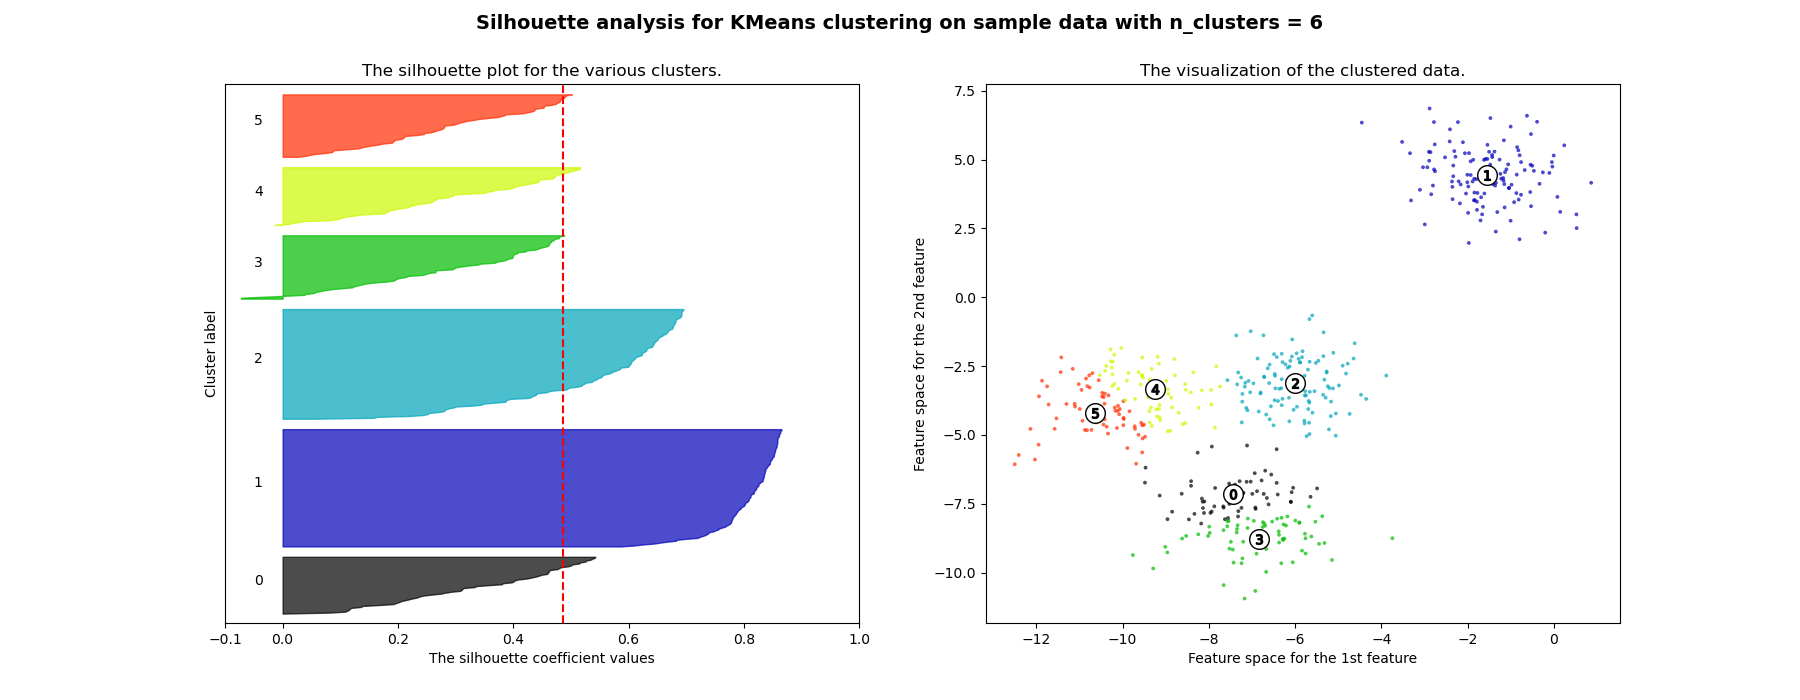
Silhouette analysis is a technique used to evaluate the quality of clustering results. It provides a measure of how similar an object is to its own cluster compared to other clusters. This analysis helps in determining the appropriateness of the number of clusters and the consistency within clusters.
Overall, silhouette analysis is a valuable tool for assessing the quality of clustering results and making informed decisions about the number of clusters and the clustering algorithm’s effectiveness.
Key Concepts:
Silhouette Score: For each data point, the silhouette score is calculated using the following formula:
where: is the average distance between the data point and all other points in the same cluster. is the average distance between the data point and all points in the nearest cluster (the cluster with the smallest average distance to ).
Interpretation of Silhouette Scores:
- A silhouette score ranges from -1 to 1.
- A score close to 1 indicates that the data point is well clustered and far from neighboring clusters.
- A score close to 0 indicates that the data point is on or very close to the decision boundary between two neighboring clusters.
- A negative score indicates that the data point might have been assigned to the wrong cluster.
Exploratory Questions:
- How does silhouette score behave in high-dimensional embedding spaces?
- Can it be trusted when clusters have unequal sizes or densities?
Silhouette Plot:
A silhouette plot displays the silhouette scores of all data points in a dataset. It provides a visual representation of how well each data point lies within its cluster.
The plot is divided into regions, each corresponding to a cluster, and the width of each region represents the average silhouette score of the points in that cluster.
Good

Bad

Applications:
Determining the Optimal Number of Clusters: By calculating the average silhouette score for different numbers of clusters, one can identify the number of clusters that results in the highest average silhouette score, indicating the best clustering structure.
Cluster Validation: Silhouette analysis helps in validating the consistency within clusters and identifying potential misclassifications.