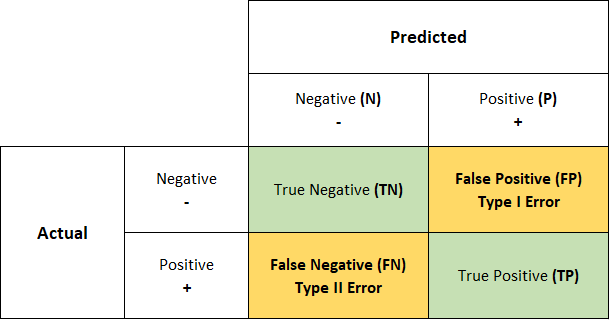
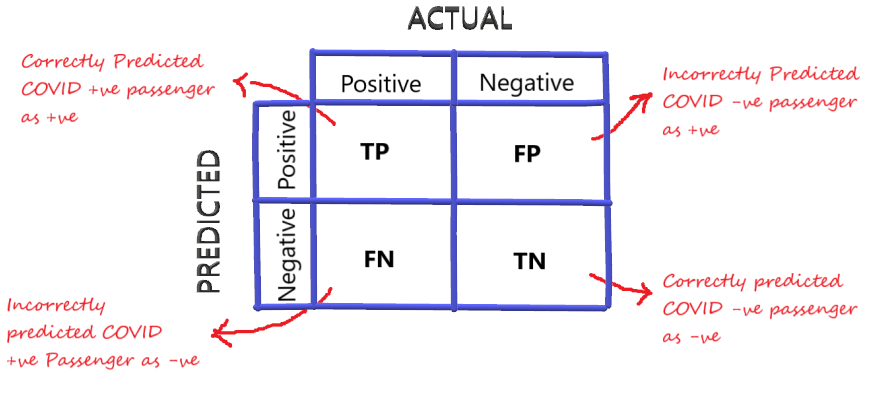
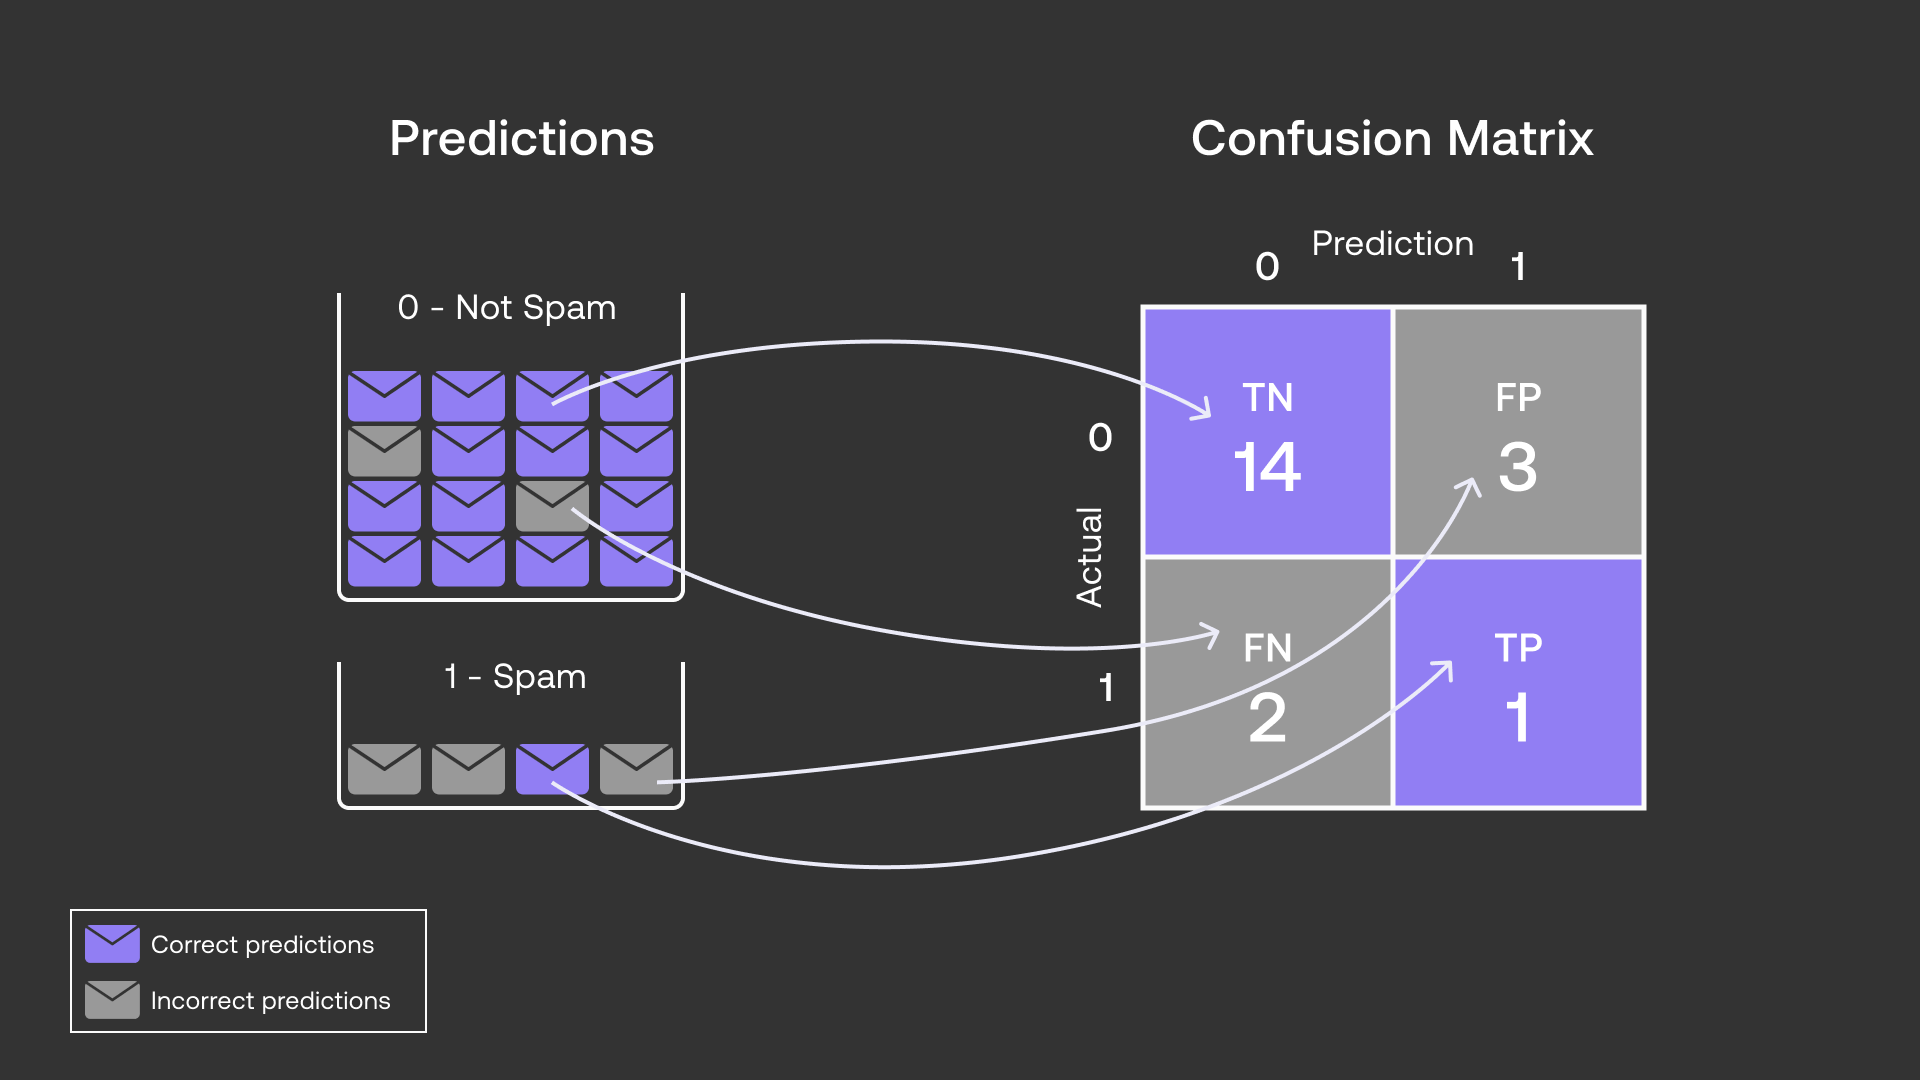
A Confusion Matrix is a table used to evaluate the performance of a Classification model. It provides a detailed breakdown of the model’s predictions across different classes, showing the number of true positives, true negatives, false positives, and false negatives.
Purpose
- The confusion matrix helps identify where the classifier is making errors, indicating where it is “confused” in its predictions.
Structure

Structure
- True Positives (TP): Correctly predicted positive instances.
- False Positives (FP): Incorrectly predicted positive instances (Type 1 error).
- True Negatives (TN): Correctly predicted negative instances.
- False Negatives (FN): Incorrectly predicted negative instances (Type 2 error).
Metrics
- Accuracy: The overall percentage of correct predictions. In this case, the accuracy is 78.3%.
- Precision: The ratio of true positives to all positive predictions (including both TPs and FPs). In this case, the precision for class 0 is 85.7% and the precision for class 1 is 66.4%.
- Recall: The ratio of true positives to all actual positive cases (including both TPs and FNs). In this case, the recall for class 0 is 80.6% and the recall for class 1 is 74.1%.
- F1 Score: A harmonic average of precision and recall. In this case, the F1-score for class 0 is 83.0% and the F1-score for class 1 is 70.0%.
- Specificity
- Recall
Further Examples


Example Code
from sklearn.metrics import confusion_matrix

# Assuming y_train and y_train_pred are your true and predicted labels
conf_matrix = confusion_matrix(y_train, y_train_pred)
print(conf_matrix)
Example Output:
array([[377, 63],
       [ 91, 180]], dtype=int64)