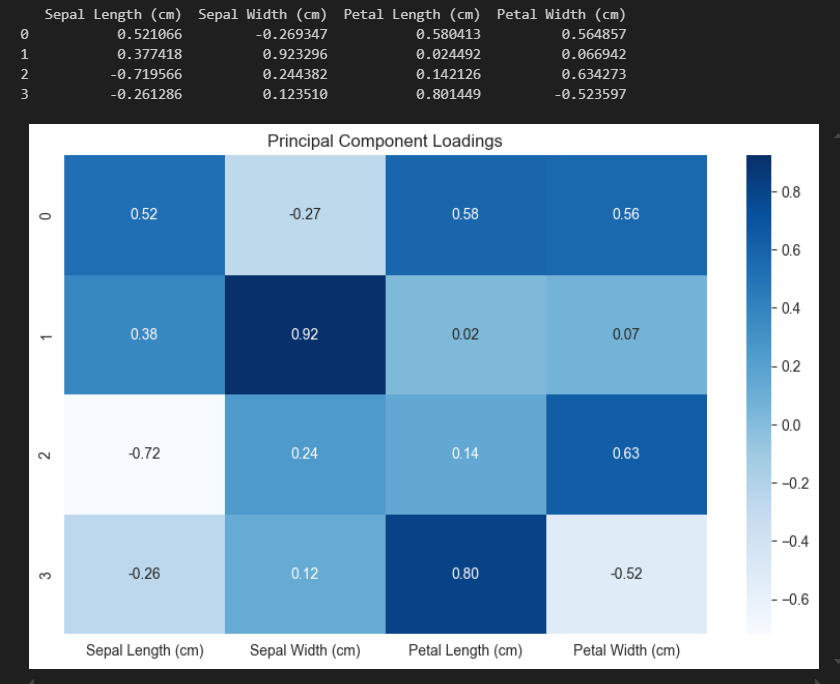
The principal components (or the new axes that explain the most variance) are stored in pca.components_ and displayed as a DataFrame for easier reading
Interpretating

How to Interpret the PCA Heatmap
This heatmap represents the principal component loadings, which show how strongly each original feature contributes to each principal component (PC).
Understanding the Heatmap Content
-
Rows = Principal Components (PCs)
- Each row corresponds to a principal component (e.g., PC1, PC2, PC3, etc.).
- PC1 captures the most variance, PC2 captures the second-most, and so on.
-
Columns = Original Features
- Each column represents an original feature from the dataset (e.g.,
sepal length,sepal width, etc.).
- Each column represents an original feature from the dataset (e.g.,
-
Cell Values = Loadings
- Each cell contains a loading coefficient, which tells us how much that feature contributes to the corresponding principal component.
- The values range from -1 to 1:Close to 1 → The feature strongly contributes to that PC in the positive direction, ect.
Key Insights from the Heatmap
-
Which features are most important for each PC?
- Look for the largest absolute values in each row.
- Example: If
sepal lengthhas a high positive value in PC1, it means PC1 is largely influenced by sepal length.
-
Feature Groupings & Correlations
- Features with similar values in a PC vary together in the data.
- Example: If
sepal lengthandsepal widthhave similar values in PC1, they might be Correlation correlated in the dataset.
-
Interpreting the First Few Principal Components
- PC1 often represents the main pattern in the data (e.g., overall size of the iris flowers).
- PC2 might represent a different pattern (e.g., a contrast between petal and sepal size).
- Together, PC1 and PC2 often explain the majority of variance in the dataset.
Example Interpretation (Hypothetical Output)
| Sepal Length | Sepal Width | Petal Length | Petal Width | |
|---|---|---|---|---|
| PC1 | 0.70 | -0.40 | 0.85 | 0.75 |
| PC2 | -0.60 | 0.80 | -0.35 | -0.45 |
PC1 Interpretation: Petal length and sepal length have high positive loadings, meaning PC1 mainly captures flower size.Sepal width has a negative loading, meaning flowers with large sepals tend to have smaller widths. |
PC2 Interpretation: Sepal width has the highest positive loading, while sepal length has a negative loading, suggesting that PC2 contrasts width vs. length.
How to Use This Information?
Feature Selection: If one PC captures most of the variance, we can reduce dimensionality and keep only the most important PCs.