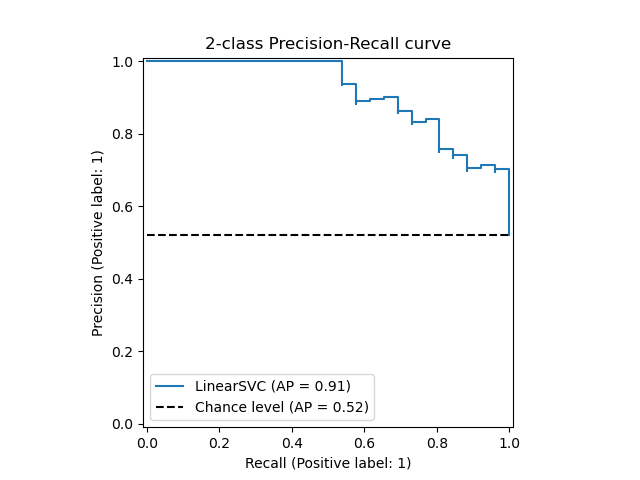
A precision-recall curve is a graphical representation used to evaluate the performance of a Binary Classification model, particularly in scenarios where the classes are imbalanced. It plots precision (the positive predictive value) against recall (the true positive rate) for different threshold values.
Overall, precision-recall curves are a valuable tool for assessing the tradeoffs between precision and recall, helping to choose the optimal threshold for classification based on the specific requirements of the task.
Resources
In ML_Tools see: ROC_PR_Example.py
Precision Recall Curve:
Plot: The curve is generated by varying the threshold for classifying a positive instance and plotting the corresponding precision and recall values. Each point on the curve represents a precision recall pair at a specific threshold.
Interpretation:
- Be cautious of the class Distributions impact on the curve’s shape. A curve that appears favorable might still represent poor performance if the positive class is very rare.
- A steep precision-recall curve indicates that the model maintains high precision across a range of recall values, which is desirable. Conversely, a more gradual curve might suggest a trade-off between precision and recall.
- A model with high precision and high recall is considered to perform well. However, there is often a tradeoff between Precision or Recall.
- The area under the precision-recall curve (not the same as AUC) is a single scalar value that summarizes the performance of the model. A higher AUCPR indicates better model performance.
Use Cases: precision-recall curves are particularly useful in situations where the positive class is rare or when the cost of false positives and false negatives is different. They provide more insight than ROC (Receiver Operating Characteristic) curves in these scenarios because they focus on the performance of the positive class.

Other features
Multi-Class Scenarios
- Adapting for Multi-Class Problems: Precision-recall curves can be extended to multi-class classification problems by using strategies like one-vs-rest (OvR). In this approach, a separate precision-recall curve is computed for each class, treating it as the positive class while considering all other classes as negative.
Comparison with ROC (Receiver Operating Characteristic)
- When to Use Precision-Recall Curves: Precision-recall curves are particularly useful over ROC curves in scenarios with highly imbalanced datasets. They provide a more informative picture of a model’s performance by focusing on the positive class, which is often the minority class in imbalanced datasets.